unit-1
1. What are the central problems of economy?
Because resources are limited but human wants are unlimited, every economy faces three fundamental questions:
- What to Produce & how much to produce: The ecomony has to decide what to produce and in what quantity.
- How to Produce: The ecomony has to choose the method of production, wheather labour intensive or capital intensive.
- For whom to produce: The economy has to choose how the produced goods and services will be distributed among different people in society.
2. What do you mean by opportunity cost?
Opportunity cost refers to the value of the next best alternative that is sacrificed when a choice is made. Since resources are limited, choosing one option means giving up another option.
Therefore, the benefit of the forgone alternative is called opportunity cost.
Opportunity Cost = What we give up or Sacrifice to get something else.
Example:If a person spends money on a mobile phone instead of a laptop, then the benefit of the laptop is the opportunity cost.
3. State the law of demand.
The law of Demand states that, while other factors remain constant, there is a inverse relationship between price and quantity demanded of a product.
As the price of the product increases, the quantity demanded
decreases and vice-versa. This inverse relationship forms the basis of the
demand curve, which is typically downwards sloping.
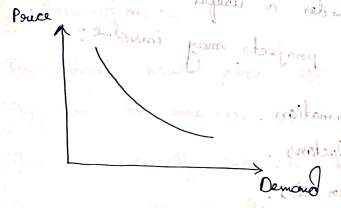
where:
- X-axis: quantity demanded
- Y-axis: Price
- Downward slope: shows that as price decrease then demand increase.
Types of Demand
There are two main types of demand:
- Individual Demand
- Market Demand
4. What do you mean by individual demand and market demand?
Individual Demand

Individual demand refers to the quantity of a particular good or service that a single consumer is willing and able to buy at different prices during a given period of time, asuming all other factors constant.
It reflects the consumer's preference and purchasing power at various price levels.
Individual demand can be influenced by numerous factors such as:
- income
- preferences
- price of related goods etc.
Market Demand
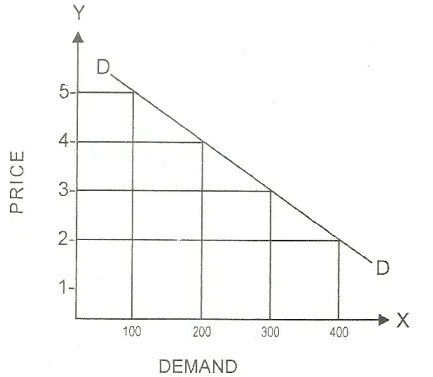
Market demand refers to the total quantity of a good or service that all consumers in a market are willing and able to purchase at different prices during a given period of time.
It is the aggregate of individual demands for a product across all consumers in a market.
Market demand is influenced by a variety of factors:
- The number of consumers
- Their individual preferences
- Their income levels
5. How demand curve shifts along with quantity demand?
Movement along the demand curve means a change in quantity demanded due to a change in the price of a commodity,
while other factors remain constant.
- When the price decreases, quantity demanded increases. This is called extension of demand.
- When the price increases, quantity demanded decreases. This is called contraction of demand.
If the price of a product falls from ₹50 to ₹30, consumers buy more of it. This causes movement along the same demand curve.
6. What is price elasticity of demand?
Price elasticity of demand (PED) measures how much the quantity demanded of a product changes when its price changes.
The formula is:
If
- Demand is elastic: Consumers are very responsive to price changes.
- Demand is inelastic: Consumers are not very responsive to price changes.
- Unit elastic: Percentage change in demand equals percentage change in price.
practice numericals
7. State the law of supply.
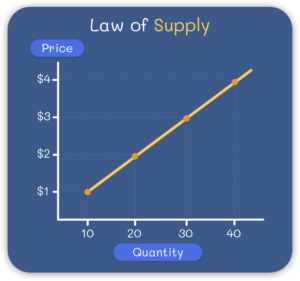
The Law of Supply states that while other factors remains constant, there is a direct relationship between price and quantity supplied of a commodity.
When the price of a commodity increases, its quantity supplied also
increases. Similarly, when the price decreases, quantity supplied decreases.
- If the price of mangoes rises, sellers will supply more mangoes.
- If the price falls, sellers will supply fewer mangoes.
here we are actually talking about profit.
Details
like for a mango chasi:
-
When the market price of mangoes is high: You want to take advantage of those high prices. You'll pull out all the stops to harvest, pack, and supply as many mangoes to the market as possible because every single sale brings in a massive profit margin.
-
When the market price of mangoes drops low: Your profit margin shrinks. It might barely cover the cost of picking them and paying for transport. As a result, you back off. You supply fewer mangoes to the market, perhaps holding onto stock or switching your resources to a more profitable fruit.
8. What do you mean by economics and engineering economics?
Economics
Economics is a social science that studies how people and society use limited resources to satisfy unlimited human wants. It deals with the production, distribution, consumption, and exchange of goods and services.
Engineering Economics
Engineering economics is a branch of economics that applies economic principles and techniques to engineering projects and decisions. It helps engineers compare costs, benefits, and alternatives in order to select the most economical and efficient solution.
9. Define the terms determinants of demand, demand function, elastic and non-elastic goods.
Determinants of Demand
Determinants of Demand are the factors that affect the demand for a commodity.
Demand Function
Demand function shows the relationship between the demand for a commodity and the factors affecting it, especially its price.
where:- Quantity of Demanded
- Price of goods
- Income
- Price of related goods
- Tastes and Preference
- Expectation
- Number of buyers
Elastic Goods
Elastic goods are those goods whose demand changes greatly due to a small change in price.
Example: Luxury items, branded clothes.
Non-Elastic (Inelastic) Goods
Non-elastic goods are those goods whose demand changes very little even when the price changes.
Example: Salt, medicines
10. Derive the relationship between price, total revenue & price elasticity of demand.
We konw,
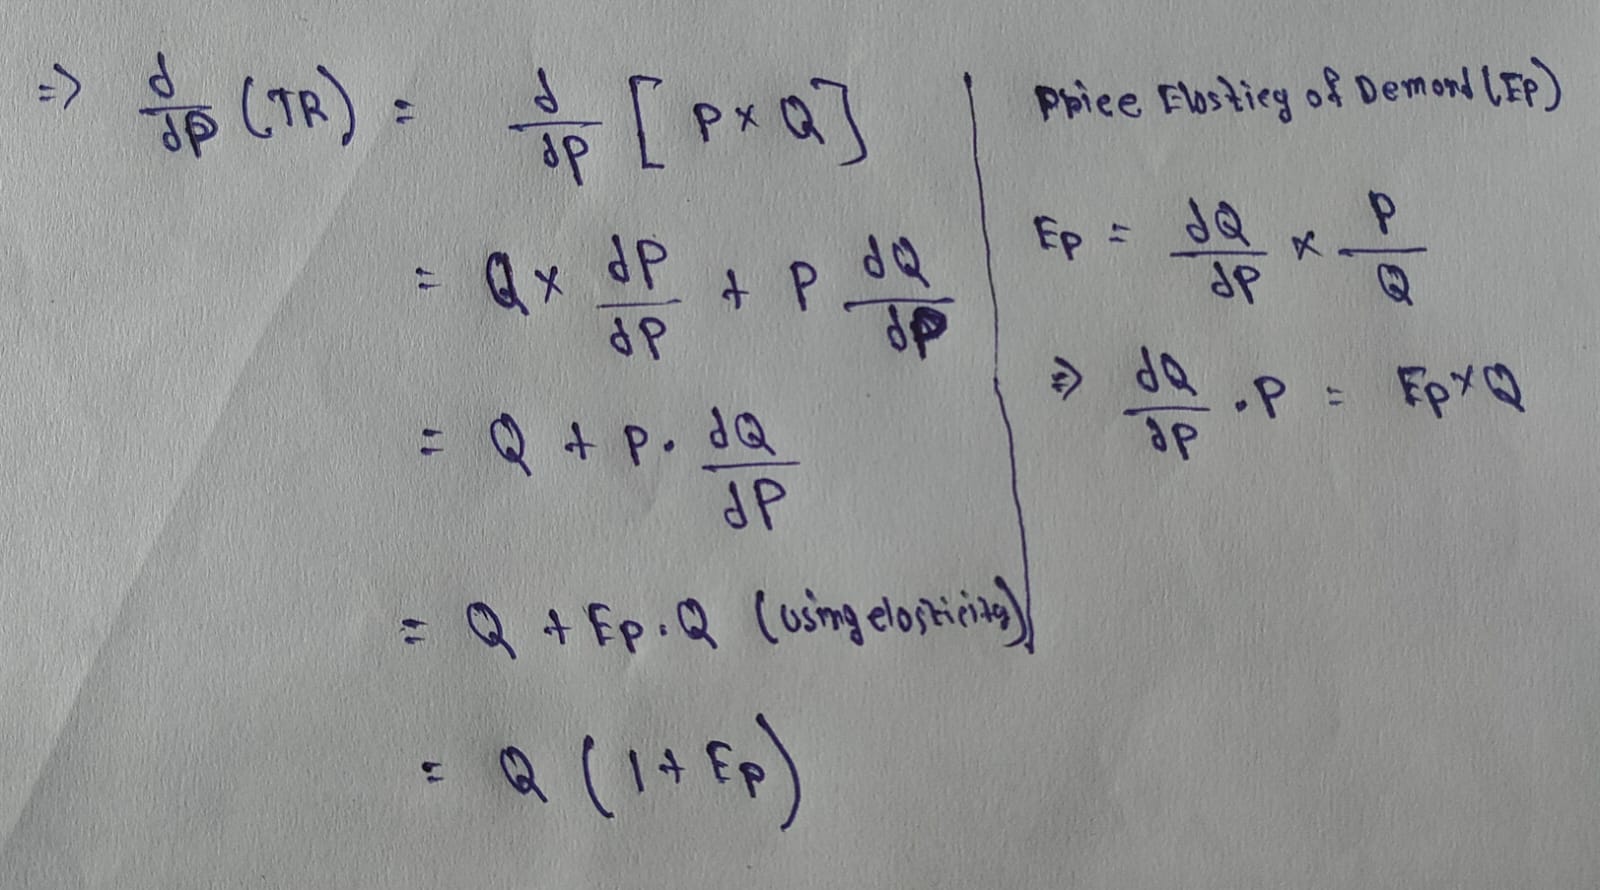
If:
- TR increase and price decrease.
- TR decrease and price increase.
- TR is unchanged.
11. What are the causes of scarcity of resources?
scarcity is the economic condition where limited resources are not enough to satisfy unlimited human wants.
This forces us (individuals, businesses, and governments) to make choices about how to allocate resources efficiently, leading to concepts like opportunity cost and trade-offs.
- Unlimited Human Wants: Human wants are unlimited, but resources are limited.
- Limited Availability of Resources: Natural resources like land, water, and minerals are available in limited quantity.
- Increase in Population: Growing population increases the demand for resources.
- Misuse of Resources: Wastage and overuse of resources create scarcity.
- Unequal Distribution: Resources are not equally distributed among people and regions.
12. State the relationship between engineering and economics.
Engineering and economics are deeply interconnected. As shown Below:
| Engineering | Economics |
|---|---|
| Focuses on design development, operation of systems. | Focuses on cost, value and efficiency of resources used. |
| Solves technical problem. | Solve resource allocation problem. |
| Aims to improve performance and productivity. | Aims to optimize profit and minimize cost. |
| Used tools like CAD, simulation, modeling etc. | Uses tools like NPV, IRR, cost benefit analysis. |
13. Write the supply function.
A Supply function is a mathematical expression that shows the relationship between quantity supplied of a good & its determinants.
where,
- Quantity supplied
- Price of good
- Price of inputs
- Technology
- Number of sellers
- Expectation of future Price
- government policies (Taxes & subsidies)
Above are key determinants of supply function too
There are 2 main Types of Supply Function:
- Individual Supply Function
- Market Supply Function
Individual Supply Function
Individual supply function shows the relationship between the quantity supplied by an individual seller and the factors affecting it.
Where:
- Supply of commodity X
- Price of commodity X
Market Supply Function
Market supply function shows the relationship between the total supply of all sellers in the market and the factors affecting it.
Where:
- Market Supply
- Sum of individul supplies of all sellers